2023 Video Game Statistics Every Gamer – and Game Developer – Needs to Know
Video games are enjoyed by both young and old. Playing video games provides entertainment and a temporary escape from the real world, whether it is on a console, PC, or mobile device. And the worlds that these video games can transport us to, the powers they can temporarily grant us and the entertainment they can provide are quite literally seemingly endless.
Video games are big business too, as they are the fastest-expanding section of the global entertainment market by far.
Want some numbers and facts to help you visualize all of this and more? Here are some up-to-date video game statistics that might just prove very eye-opening, especially if you thought you knew all about what video games have to offer both players and video game developers.
Currently, The US Gaming Market is Valued at $90.1 billion

Eight of the previous ten years, starting in 2012, saw an increase in the value of the video gaming sector. In fact, the gaming industry is now worth roughly 60 billion dollars more than it was in 2012 when it was valued at $31.23 billion.
The COVID-19 pandemic may be partly to thank for this growth. During the first week of the pandemic, US gamers spent an additional 45% of their time playing video games.
The fact that global video game sales climbed noticeably in March 2020 emphasizes this even more.
Mobile games have also had a significant impact on the value of the video gaming industry, as we’ll examine in greater depth later in this piece.
China and the US Generate the Highest Video Game Revenues
In 2022, it is anticipated that the Chinese video gaming sector will generate $50.18 billion. In the same year, it is anticipated that the US gaming market will generate $47.62 billion. China and the US collectively produce more gaming income than the other top 10 major markets put together.
Japan has the third-largest global gaming market, with revenues of $22.01 billion. This amount is less than half what it is in China.
But compared to South Korea, which is ranked fourth, Japan generates almost three times as much money from video gaming. And more than the combined GDP of the top five European countries (Germany, the UK, France, Italy, and Spain).
Asia is home to three of the top four global gaming markets. Meanwhile, North America is home to two of the top 10 global gaming marketplaces.
Here’s a closer look at those numbers:
1 China $50.18 billion
2 United States $47.62 billion
3 Japan $22.01 billion
4 South Korea $8.48 billion
5 Germany $6.84 billion
6 United Kingdom $5.73 billion
7 France $4.27 billion
8 Canada $3.64 billion
9 Italy $3.12 billion
10 Brazil $2.69 billion
US Gamers Spend a Lot of Cash on Video Gaming
Wondering how many gamers it takes to generate this kind of income? Those numbers break down as follows:
Number of people classified as gamers (play video games at least once a week)
1 China 742.19 million
2 United States 197.16 million
3 Japan 78.1 million
4 South Korea 33.8 million
5 Germany 49.76 million
6 United Kingdom 39.1 million
7 France 39.34 million
8 Canada 21.91 million
9 Italy 37.64 million
10 Brazil 100.74 million
As you can see, despite having a much smaller population of gamers than China, the US generates almost the same video gaming revenues as China, which means that US-based video gamers spend a lot more per head on video gaming than any other nation of gamers in the world.
The Majority of US Video Gamers are Adults

Video games are for kids? Not according to video gaming statistics on player age they aren’t.
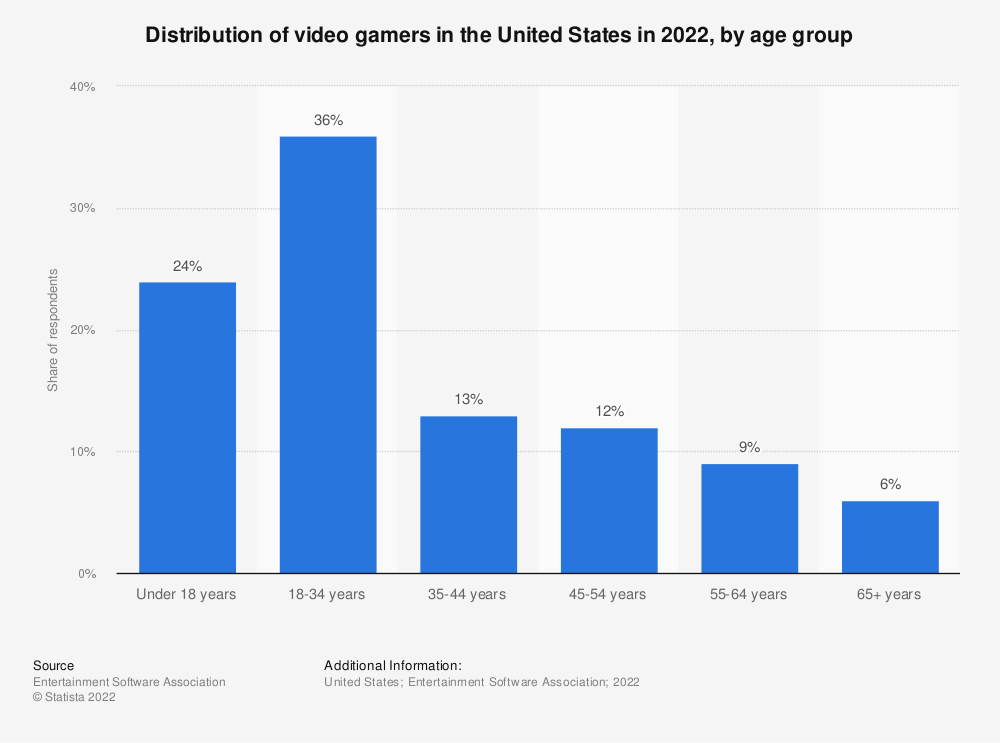
The largest player demographic by age in the US is the 18-34 demographic. While the under-18 gaming population is close – 36% vs 24% of the total gaming audience – this simple gaming statistic is one you can offer easily whenever some spoilsport suggests that it might be time for you to ‘grow out’ of your video gaming habit.
The figures are very similar across the globe in actual fact. In the UK, for example, the 18-34 demographic also edges out the under 18’s, by almost 4%.
There Are Still More Male Video Gamers Than Female
Over the past 15 years, the ratio of male to female gamers has mostly remained steady.
Since 2006, the percentage of female gamers has ranged between 38% and 48%, reaching a peak in 2014. Only 41% of gamers today are female, according to the gender breakdown of video game consumption.
Additionally, men are more likely to buy video games and in-game items. Males were more likely than females to make in-game purchases in four out of six categories, according to a 2018 survey. But female gamers were more likely to purchase time savers and power-ups.
Video Game Statistics on Home Console Use

About 28% of all gaming revenue was generated last year by home consoles from companies like Sony, Microsoft, and Nintendo, together with the games, merchandise, and accessories that go along with them.
Compared to console or PC gaming ($35.9 billion), mobile gaming brought in a lot more money ($90.7 billion).
Despite this, the COVID-19 pandemic has resulted in a noticeable rise in in-app purchases across all gaming platforms.
The annual income breakdown by the platform is as follows:
Platform Annual Income (Billions)
- PC $35.9,
- Console $49.2
- Mobile $90.7
Here are some more video gaming statistics offering insight into the world of home console gaming:
Xbox Live Has Surpassed 100 Million Subscribers

Xbox Live is required in order to play Xbox games online with others. Even while Xbox Live is a free service, many of its most appealing features (such as online gaming) are hidden behind a tiered structure that requires payment.
Between Q1 2016 and Q4 2020, the number of Xbox Live subscribers climbed by more than two times.
From Q1 to Q4, there were 49 million Xbox Live subscribers in 2016, up from 39 million. The following years saw a continuation of this pattern, with increases of 6 million in 2017, 4 million in 2018, and 8 million in 2019.
From 65 million users in Q4 2019 to 90 million in April 2020 and 100 million in December 2020, user numbers have increased dramatically since the ’20s’ began, with Microsoft stating that by the end of 2022 they expect to surpass 120 million Xbox Live users.
PlayStation Plus Subscriptions are Increasing Too

Sony’s PlayStation Plus subscription is NOT free, and it is not required to play all of its games, so the take-up of the offering has been slower than that of Xbox. However, as more developers require it for online play, and the back catalogue of previous-gen games increases, the number of PlayStation Plus users is increasing as well.
There were reportedly 47.4 million PlayStation Plus customers as of March 2022. This is an increase of 5.9 million from March 2020 and an increase of 11 million from March 2019.
Nintendo’s Switch Has Staying Power

Unlike Sony and Microsoft, Nintendo seems to be in no rush to keep bringing new-gen consoles to the market. While both of the other companies have released new generation consoles in the same time span, Nintendo has yet to even hint at a successor for the Nintendo Switch, which debuted in 2017.
And maybe they don’t have to. The Nintendo Switch has generated 107.6 million sales since its launch in March 2017. The Wii U, Nintendo’s previous device, peaked at 3.9 million units sold in 2014. This is a massive improvement.
The success of the platform has been primarily attributed to its first-party games. Exclusive Nintendo properties include well-loved series like The Legend of Zelda, Pokémon, Animal Crossing, and Super Mario.
Nintendo Simply Sells More Console Games

Often, when discussing console video gaming, people concentrate on whatever the latest offering from Sony or Microsoft is. However, over the past fifteen years, it’s been Nintendo that has dominated console game sales, and significantly so. Check out this list:
Rank Title Publisher Units Sold (Million) Year of Release
#1 Wii Sports Nintendo 82.65 2006
#2 Super Mario Nintendo 40.24 1985
#3 Mario Kart Wii Nintendo 35.98 2008
#4 Wii Sports Resort Nintendo 32.90 2009
#5 Pokémon R/G/B Nintendo 31.37 1998
#6 Tetris Nintendo 30.26 1989
#7 New Super Mario Bros. Nintendo 29.85 2006
#8 Wii Play Nintendo 28.92 2007
#9 New Super Mario Bros. Wii Nintendo 28.51 2009
#10 Duck Hunt Nintendo 28.31 1985
#11 Nintendogs Nintendo 24.68 2005
#12 Mario Kart DS Nintendo 23.26 2005
#13 Pokémon G/S Nintendo 23.10 2000
#14 Wii Fit Nintendo 22.70 2008
#15 Kinect AdventureMicrosoft Game Studios 22.10 2010
#16 Wii Fit Plus Nintendo 21.81 2009
#17 GTA: San Andreas Rockstar Games 20.81 2004
#18 Super Mario World Nintendo 20.61 1991
#19 GTA V Rockstar Games 20.32 2013
#20 Brain Age Nintendo 20.16 2006
As you can see, the only non-Nintendo titles to even make a dent here are two of the Grand Theft Auto titles, which goes a long way to explaining why Grand Theft Auto 6 will be such a big deal if it ever sees the light of day.
The most streamed video game on Twitch is Grand Theft Auto V.

Speaking of GTA, if you thought that shooters dominated the Twitch game streaming charts you’re wrong.
Grand Theft Auto V was the most streamed game on Twitch in 2022, with nearly 20% more streams than League of Legends, which came in second. Even though it was first published in September 2013, GTA V has maintained its popularity, averaging 128.8 million hours of viewing per month.
League of Legends, an MMORPG, received 102.3 million hours of views, while Counter-Strike: Global Offensive received 79.8 million hours of views.
Valiant, Apex Legends, and Teamfight Tactics were the only three of the top 10 most-streamed games that were published after 2017.
With 32 million streams, FIFA 21 from EA Sports was the most popular sports game on Twitch in April 2021. The 2022 numbers don’t include any sporting games.
Again, the case for GTA 6 to come out SOON is a big one (although we’re sure that Rockstar is well aware of that.)
Mobile Gaming Stats

Earlier, we showed you that mobile gaming has become the runaway leader in video gaming in terms of revenue generation. And why should that be a surprise?
While not everyone wants to invest $400+ in a gaming console, almost everyone has a smartphone and considers that phone to be essential to their life. And for many that include their life as a video gamer, as the next set of video game statistics we are going to share demonstrates:
- Globally, 3.9 billion people used smartphones in 2021.
- Consumer spending on mobile games surpassed $116 billion in 2021, up 16 billion from the previous year.
- By 2025, there will be $138 billion in player spending on mobile gaming.
- The top three markets for mobile gaming revenues in 2021 were China, the US, and Japan, with \$56 billion, \$43 billion, and \$20 billion in sales, respectively.
- The top three download markets in 2021 were China, India, and the US, with 98 billion, 26 billion, and 12 billion downloads, respectively.
- In 2021, gamers downloaded 82.98 billion mobile games.
- The App Store is expected to generate 42% of its income from games and 58% from non-games by 2025.
- By 2025, it is predicted that mobile games will account for 71% of Google Play’s revenue.
Puzzle Games Rule on iOS

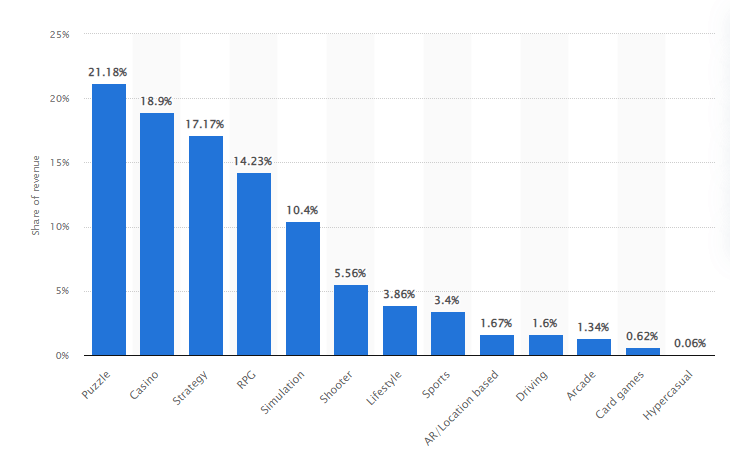
As you can see from the chart above, puzzle games are the most popular gaming genre with IOS gamers, followed by casino, strategy and RPG. Android statistics are much harder to come by, as those users do not usually make exclusive use of the Google Play Store for their gaming downloads.
The Most Popular Mobile Games By Player Share
Genres aside, which are the most popular mobile games with all smartphone users right now? According to App Annie, these are currently the big winners:
- Free Fire
- Subway Surfers
- Roblox
- Bridge Race
- Candy Crush Saga
- PUBG Mobile
- Ludo King
- Hair Challenge
- Among Us!
- Join Clash 3D
When it comes to revenue generation – which they would-be video game publishers amongst you are obviously going to be interested in, that breaks down as follows:
- Roblox
- Genshin Impact
- Coin Master
- Honour of Kings
- Candy Crush Saga
- PUBG Mobile
- Pokémon Go
- Uma Musume Pretty Derby
- Game for Peace
- Homescapes
So if you ever wondered why Roblox is so important to us at Pearl
Lemon Games is a game development platform to generate revenue for our clients, know you know.
Video Gaming Innovation and Evolution Statistics
In the US, digital purchases of video games predominate.
Over the past ten years, the percentage of video games sold digitally has grown at a rapid pace.
Only one in five video games was digitally sold in the US in 2009. Since that time, sales of digital video games have increased each successive year.
Annual digital sales surpassed physical sales in 2013. In 2018, the US sold 83% of all video games digitally, a record at the time.
Globally, the value of video game subscriptions was estimated to reach $7.5 billion in 2021.
One of the fastest-growing market sectors in the video game business is subscription services (“Games as a Service”).
As a result, this year is anticipated to experience annual growth of 13.5%. In 2023, a slower 4.5% growth is anticipated, followed by a 9.4% growth in 2024.
VR Gaming IS Growing

Despite the fact that Meta is not profiting from the Metaverse in the way it hoped yet, VR gaming in general is increasing in both popularity and revenue generation.
Global revenue for VR gaming has consistently increased year over year since 2017. The industry reportedly made $0.4 billion in 2017.
The following year, this amount increased to $0.6 billion, and in 2019, it to $0.8 billion.
In fact, between 2021 and 2028, VR gaming revenue is predicted to increase at a CAGR of 31.4%.
This amount is anticipated to grow significantly by 2028, reaching $53.44 billion.


